


-
Fungi are one of the dominant groups of eukaryotic microorganisms, playing a crucial role in various ecosystem functions and services, including soil nutrient cycling, litter decomposition, and the regulation of plant diversity and productivity. Biochemical pathways used in food production, medicine, biofuel generation, and other products are furthermore accomplished by fungi. Fungal pathogens contribute to significant losses in global food and forestry production (Kapahi et al. 2021; Venturella et al. 2021; Kour et al. 2022) . Beyond their role in nutrient cycling, fungi can also contribute to the structure of soil by forming hyphal networks that bind soil particles, thereby improving soil aeration and water retention (van der Heijden et al. 2015). Therefore, understanding soil fungal diversity is crucial for sustainable agriculture and ecosystem health (Oliveira et al. 2024; Vassilev & Mendes 2024), as well as in phytoremediation (Gil-Martínez et al. 2021). Several studies have evaluated soil fungal diversity at regional and global scales, revealing that climate and soil pH are the primary predictors of fungal richness (Tedersoo et al. 2014, 2020; Větrovský et al. 2020; Djemiel et al. 2024). Additionally, previous studies have demonstrated that climate, soil type, and land use significantly affect the composition and abundance of soil fungi (Drenovsky et al. 2010; Newsham et al. 2016; Szoboszlay et al. 2017).
Africa is experiencing a faster rate of warming (~1.5 times faster) compared to the global average (Collier et al. 2008). Parts of Africa, particularly the sub-Saharan regions, are particularly vulnerable to climate and land-use change (Tedersoo et al. 2022). Many aspects of African fungal diversity remain relatively underexplored compared to other continents, based on information from the Global Soil Mycobiome consortium (GSMc), the GlobalFungi database, and other studies (Větrovský et al. 2020; Tedersoo et al. 2021; Van Nuland et al. 2025). Continent-wide analyses of fungi and fungus-like organisms diversity in Africa are also limited (Piepenbring et al. 2020; Sarkodee-Addo et al. 2020; Meidl et al. 2021; Alem et al. 2022; Cowan et al. 2022; Makhalanyane et al. 2023), as most of these studies include fewer than half of the countries in Africa. This is primarily due to various challenges in sampling on the continent and limited local research expertise. As a result, there is a limitation in the empirical data on soil fungal diversity in many African regions, hindering our understanding of their ecological function and how they respond to environmental change (Liu et al. 2022; Casadevall 2023). A deeper understanding of the diversity and distribution of fungal guilds in Africa is crucial for conserving both fungal biodiversity and the ecosystem services they provide, particularly in agroforestry systems in economically important crops such as Theobroma cacao (Kumah et al. 2025).
In this study, we used third-generation DNA sequencing data from the recently published Global Soil Mycobiome consortium dataset (Tedersoo et al. 2021) and newly collected samples from Ghana, Benin, Liberia, Ivory Coast, and Algeria to evaluate the relative contributions of climatic, edaphic, and spatial factors in shaping soil fungal diversity and community turnover across diverse African ecosystems. We hypothesized that (1) the diversity of fungal taxa varies across different African biomes, with high fungal richness in tropical rainforests, reflecting the influence of biome-specific environmental conditions, (2) frequent extreme temperatures and prolonged droughts influence fungal diversity, especially in arid and semi-arid regions, and (3) the composition and diversity of soil fungal taxa in African ecosystems are influenced by the presence and diversity of plant communi¬ties, which act as potential hosts for ectomycorrhizal fungi (EcMF) and arbuscular mycorrhizal fungi (AMF). Greater fungal diversity and functional specialization are expected in regions with higher potential host plant diversity, such as the high rainforest regions of the Congo Basin and the Guineo-Congolian forest belt in West Africa (Linder 2001; Tondeleir et al. 2025). Ultimately, our results outline the overall pattern of fungal diversity in Africa, identifying regions of high conserva-tion priority.
-
To minimize sampling bias, we adopted a standard global sampling protocol as described by Tedersoo et al. (2014), including 222 composite samples from the GSMc and 245 newly collected samples, resulting in a total of 467 samples representing different vegetation types across 32 countries in Africa. Each sample consisted of forty (40) soil cores (5 cm in diameter to 5 cm depth) collected from the rhizosphere of 20 arbitrarily chosen trees or shrubs, separated by a minimum of 8 m from each other, within an area of 2500 m2 (50 m x 50 m square plot) or 56 m diameter circular plots (Fig. 1A). Soil samples were taken from between 1 to 1.5 m in opposite directions from of each selected tree (or arbitrarily selected spot in treeless areas) after removing loose litter. Samples were collected into ZipLoc plastic bags using disposable gloves. The 40 soil cores taken at each site were pooled, coarse roots and stones were removed, and a subset of the soil was air-dried at <35 °C within 24 hours after collection. Dried soil samples were stored in ZipLoc bags with silica gel to minimize humidity.
In the laboratory, we pulverized the dried soil into a fine powder by rubbing the soil bags with our hands and bead beating using a Retsch MM400 Mixer Mill (Retsch, Haan, Germany). We extracted DNA from 0.25 g of soil from each composite sample using the PowerMax Soil DNA Isolation kit (Qiagen, Carlsbad, CA, United States), following the manufacturer’s instructions. FavorPrepTM Genomic DNA Clean-Up kit (Favorgen, Vienna, Austria) was used to purify DNA extracts. Polymerase chain reaction (PCR) was performed using the universal eukaryote primers ITS9mun and ITS4ngsuni (Tedersoo & Lindahl 2016; Tedersoo & Anslan 2019). For amplification, the PCR mixture comprised 5 µl of 5x HOT FIREPol Blend Master Mix (Solis Biodyne, Tartu, Estonia), 0.5 µl each of forward and reverse primers (20 mM), 1 µl of DNA extract, and 18 µl of ddH2O. Thermal cycling included an initial denaturation at 95 °C for 15 min, 25–30 cycles of denaturation for 30 s at 95 °C, annealing for 30 s at 55 °C, elongation for 1 min at 72 °C, final elongation at 72 °C for 10 min, and a wind-down at 4 °C. Duplicate PCR products were pooled, and the presence of a 600-800 base DNA band was checked on a 1% agarose gel. In cases where the amplicon bands were weak, we repeated the PCR amplifica¬tion with the number of cycles increased to 37 or a higher concentration of template DNA. Positive and negative controls were used to detect and eliminate contaminated PCR products. The pooled amplicons were shipped to the Norwegian Sequencing Centre at the University of Oslo for library preparation and sequencing. Pacific Biosciences (PacBio Palo Alto, USA) SMRTbell libraries were prepared following the manufacturer’s instructions and sequenced on a Sequel II instrument using the Sequel II Binding kit 2.1, sequencing chemistry 2.0, loading by diffusion, a movie time of 15 h, and a pre-extension time of 20 min. Samples producing < 2,000 reads were re-amplified and re-sequenced.
-
Circular consensus sequences (CCS) were generated using SMRT Tools v.9.0.0.92188 (PacBio) with default settings, including a minimum of three passes and a minimum accuracy of 0.99. Subsequent bioinformatics analyses were performed using the NextITS pipeline v.0.5.0 (Mikryukov et al. unpublished; https://github.com/vmikk/NextITS) and the Ne-xtflow workflow manager (Di Tommaso et al. 2017). Seque-nces were demultiplexed based on dual 12‐base pair primer indices (Tedersoo et al. 2022) using LIMA v.2.9.0 (PacBio, https://lima.how/), and sequences lacking primer sites were removed using cutadapt v.4.6 (Martin 2011). Full‐length internal transcribed spacer (ITS) sequences were extracted using ITSx v.1.1.3 (Bengtsson-Palme et al. 2013). Chimeric sequences were eliminated with VSEARCH v.2.27.0 (Rognes et al. 2016) via a two‐step approach: first, de novo detection with the UCHIME algorithm (Edgar et al. 2011) using a maximum chimera score of 0.6 (Nilsson et al. 2015), followed by a reference‐based method using the EUKARYOME database v.1.7 (Tedersoo et al. 2024). Sequences were clustered at 98% similarity threshold to generate operational taxonomic units (OTUs) (Blaxter et al. 2005). OTUs were taxonomically annotated by querying representative sequ-ences against the EUKARYOME database using BLASTn v.2.15.0+ (Camacho et al. 2009), with the ten best matches manually curated as described by Tedersoo et al. (2021). Fungal functional groups were identified at the genus level using the FungalTraits database (Põlme et al. 2020). Five fungal functional guilds (primary lifestyles) — arbuscular mycorrhizal fungi (AMF), ectomy¬corrhizal fungi (EcMF), saprotrophs, parasites, and pathoge¬ns) — were selected based on their specialized function and economic impor¬tance in ecosystem processes to compare with all fungi based on biome types.
To visualize the hierarchical taxonomic composition and coverage of fungal communities in soil samples across the continent, we generated a Krona chart using KronaTools v 2.8.1 (Ondov et al. 2011). We first calculated the relative abundance from the OTU table, then exported the taxonomy and abundance data as a tab-delimited file. This file was then converted into Krona’s hierarchical format using the ktIm-portText function from KronaTools, with computational supp¬ort from the High-Performance Computing Center of the University of Tartu. We included a supplementary file (Supplementary data file) that lists the most resolved taxonomic assignments, along with their OTUs and species hypothesis (SH) code corresponding to the SHs in the UNITE database (Nilsson et al. 2019).
Edaphic variables were determined from the composite soil samples, following the method described by Tedersoo et al. (2012). Briefly, soil pH was determined using the KCl method. Ca, P, K, and Mg concentrations were determined using the acetate lactate (AL) method after dissolving 2 g of soil in 100 mL of acetate. From 1 to 20 mg of soil, concentrations of N, C, δ15N, δ13C, and C: N ratio were determined using GC-combustion linked to isotope-ratio mass spectrometry (Tedersoo et al. 2012).
-
Unless otherwise stated, all statistical analyses were perfo-rmed using specific packages (stated in each case of use) in the R statistical computing environment (v.4.2.2) (R Core Team, 2021). Estimates of mean annual precipitation (MAP), mean annual temperature (MAT), and elevation were all obtained at 30 arc seconds from the CHELSA database (Karger et al. 2017). Based on the average monthly results, variation coefficients for MAT and MAP were created to depict temperature and precipitation seasonality. Distance from the equator (distEq) was computed using the distVincentySphere function from the geosphere package (Hijmans 2024) based on our geocoordinates. Biome type classifications (sensu Olson et al. 2001) were consolidated into four principal biome types as follows: tropical and subtropical moist broadleaf forests categorized as moist tropical forests; tropical and subtropical dry broadleaf forests classified as dry tropical forests; tropical and subtropical grassland, savanna, and shrubland grouped under savannas; and deserts and xeric shrublands designated as deserts. Additionally, two biome types — temperate broadleaf and mixed forests — were grouped as temperate mixed forests (Fig.1A). All sample plots were aggregated into six regions (Central Africa, East Africa, Northern Africa, Islands, Southern Africa, and West Africa) based on geocoordinates, national boundaries, and (Good et al. 2011) to assess the community composition of fungi at various regional levels.
To eliminate sequencing depth differences between samples and obtain a reliable alpha diversity metric, we used the residuals from a linear regression of the logarithmically transformed number of fungal OTUs against the logarithm of the sequencing depth (Tedersoo et al. 2022). Alpha diversity metrics (Shannon diversity index and richness) were determined using the vegan package in R version 2.6.4 (Oksanen et al. 2023). One-way ANOVA and Tukey's honestly significant difference (HSD) test were conducted to statistically compare alpha diversity indices with variables at (α=0.05). We calculated relative abundance as the proportion of sequence reads assigned to each unique OTU relative to the total number of reads per sample. We acknowledge that these values are not indicative of absolute community biomass. Prior to model fitting, we tested for multicollinearity among predictors by calculating variance inflation factors (VIF) using the vif() function from the car package (Fox & Weisberg 2018), which exhibited low values for all variables tested (1.47 to 2.86), indicating that multicollinearity was not a significant issue in our dataset. Climatic variables, mean temperature of the warmest quarter (BIO10), and annual precipitation (BIO12) from the CHELSA database (Karger et al. 2017) were used in combination with our fungal richness obtained in our data to generate a fine-resolution map of fungal richness using the generalized additive model (GAM). We also conducted spatial predictions of mycorrhizal fungal richness based on BIO10 and BIO12 using a random forest modelling approach (van den Hoogen et al. 2019), for AMF and EcMF separately. To assess the impact of tree cover (which in many cases consists of potential mycorrhizal species) on mycorrhizal fungal (AMF and EcMF) richness, we used the European Space Agency (ESA) Climate Change Initiative (CCI) land cover data (ESA Land Cover CCI project team, 2019) as a proxy to extract vegetation class based on our coordinates. To assess spatial autocorrelation in model residuals, we computed Moran’s I statistic (Moran 1950) using the spdep package in R (Bivand & Wong 2018).
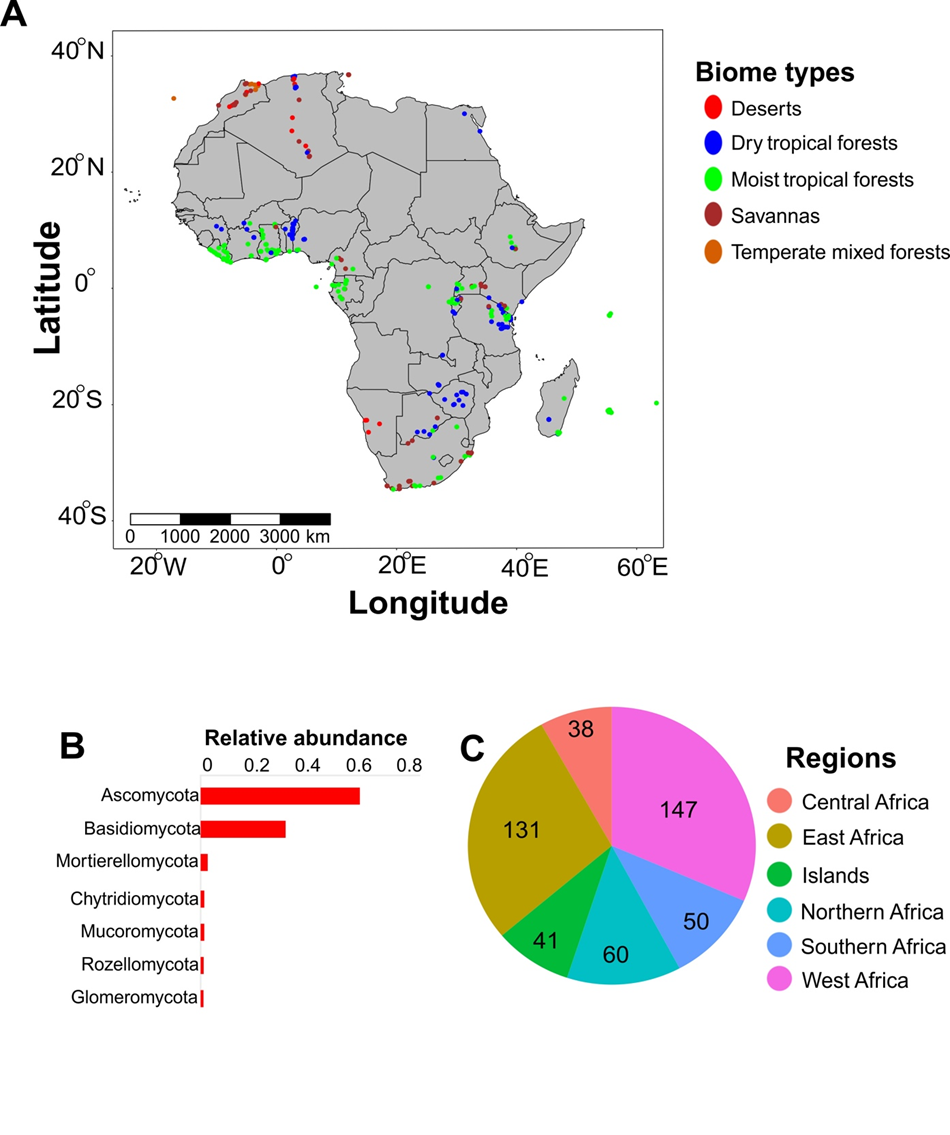 Fig 1. Sample distribution map and taxon abundance. (A) Geographic distribution of 467 sampling plots within five African biome types. (B) Mean relative abundance of dominant (>1%) phyla obtained from our samples. (C) Number of samples obtained from each region in this study.
To explore the effect of environmental variables (MAP, MAT, and biome types) and edaphic factors (pH, soil organic carbon, N, Ca, K, Mg, P, δ15N, and δ13C) on the diversity and community structure of soil fungi across Africa, we used per-mutational multivariate analysis of variance (PER¬MANOVA) as implemented in the adonis2 function of the vegan package with 999 permutations. To investigate the relationship between soil fungal communities and soil chemical properties, we performed a distance-based redun¬dancy analysis (dbRDA) using the dbrda function in the vegan package v2.6-4 (Oksanen et al. 2023). This analysis utilised the Hellinger transformation, Bray-Curtis distance, and standardized environmental variables (using method="stand¬ardize") within the decostand function from the vegan package. The random Forest(RF) function (Liaw & Wiener 2002) was used to compute variable importance, reflecting the statistical significance of each selected model in relation to its effect on the generated linear models. Non-metric multidimensional scaling (NMDS) was performed using the Bray-Curtis dissimilarity matrix to visualize commu¬nity differences among the studied variables (biome types and regions) using the metaMDS function in vegan. The beta-diversity distribution of samples was visualized on an NMDS plot. The significance of beta-diversity dissimilarity between biome types and regions was assessed using PERMANOVA with 999 permutations.
-
Taxonomic coverage, abundance, and functional diversity
After demultiplexing the 19 PacBio sequencing libraries, 3,429,761 sequences were assigned to biological samples. These sequences were further clustered into 511,437 OTUs at 98% sequence similarity threshold. Taxonomic annotation of these clustered OTUs revealed that fungi were the most abundant kingdom, corresponding to 3,200,058 sequences and 327,761 OTUs.
At the phylum level, Ascomycota (59.4%), Basidiomycota (31.7%), Mortierellomycota (2.66%), Chytridiomycota (1.38%), Mucoromycota (1.37%), Rozellomycota (1.14%), and Glom-eromycota (1.08%) were the most abundant, collectively accounting for over 90% of the relative abundance (Fig. 1B). At the order level, Pleosporales (11.4%), Hypocreales (9.97%), Agaricales (9.45%), and Eurotiales (8.11%) were the most abundant, accounting for about 40% of the relative abun-dance (Figs. 2, 3). At the family level, Aspergillaceae was the most abundant in Ascomycota, accounting for 13.8% of our data. Nectriaceae was the next most abundant family in Ascomycota, accounting for 9.77% of our data (Fig. 2). In Basidiomycota, the family Russulaceae dominated, account-ing for 16.5% of the samples in our data. The second most common family was Thelephoraceae, which made up 10.3% of sequence abundance (Fig. 3).
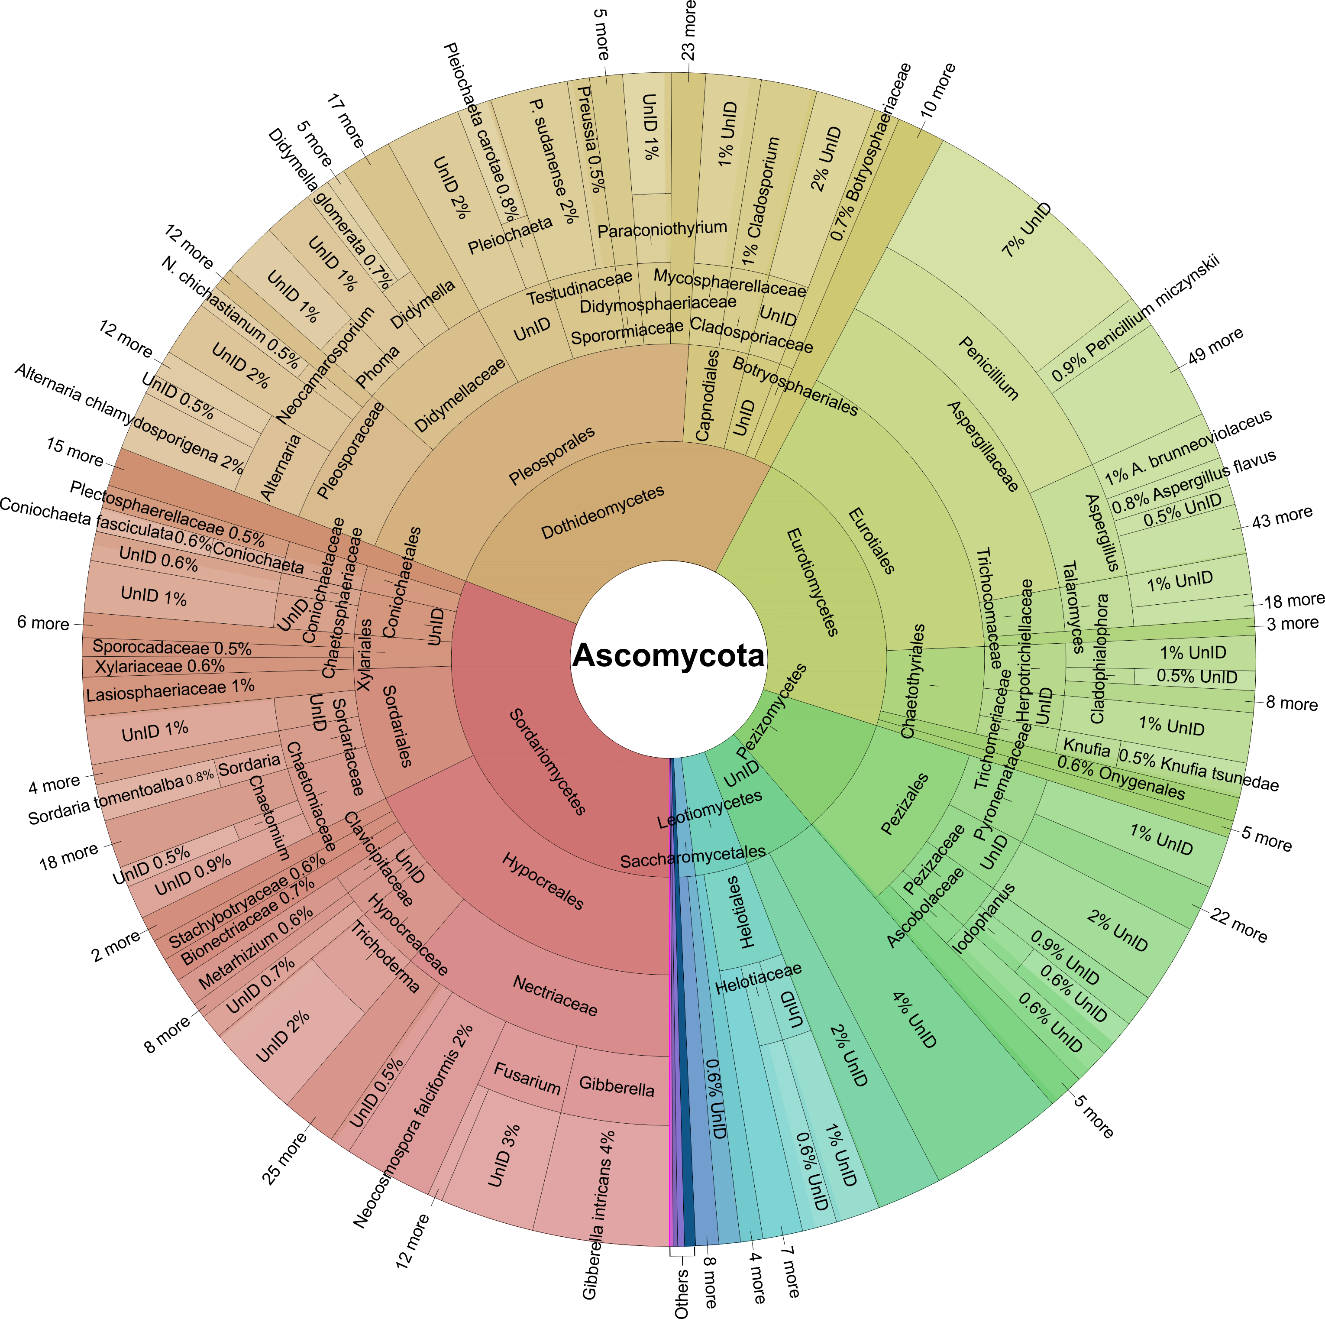 Fig 2. Krona chart indicating the taxonomic distribution of the ascomycete proportion of the recovered OTUs. UnID: unidentified at a given taxonomic level.
The analysis of fungal diversity across various African regions and biome types revealed notable differences in the relative abundance of fungal orders, underscoring the impact of environmental and geographical factors on fungal community composition in Africa. Among the top ten fungal orders, Pleosporales was predominant in deserts, savannas, dry tropical forests, and moist tropical forests. Conversely, Eurotiales was predominant in moist tropical forests, while Russulales was most prevalent in mixed temperate forests (Fig. 4A). Agaricales was well represented in all biome types, but was more dominant in moist tropical forests and savannas.
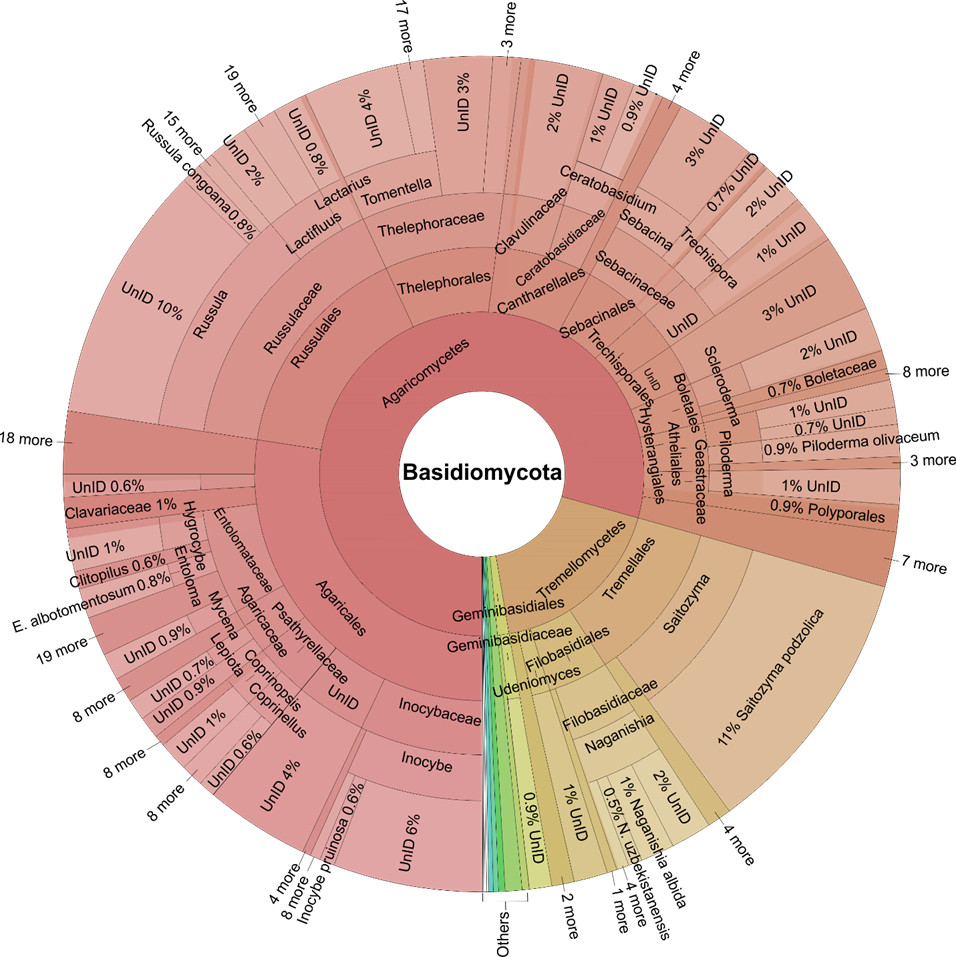 Fig 3. Krona chart indicating the taxonomic distribution of the basidiomycete proportion of the recovered OTUs. UnID: unidentified at a given taxonomic level.
At the regional level, Pleosporales was the dominant order in Northern and Southern Africa, whereas West Africa was largely characterized by Eurotiales. Hypocreales was recorded in all biomes, but was more dominant in moist tropical forests and Central Africa, suggesting a preference for high plant and insect diversity, which increases the potential host diversity for endophytic, pathogenic, and entomopathogenic genera. Russulales exhibited varying prevalence in East, Central Africa, the Islands, but was more dominant in Central Africa (Fig. 4B), primarily associated with ectomycorrhizal-dominated forests.
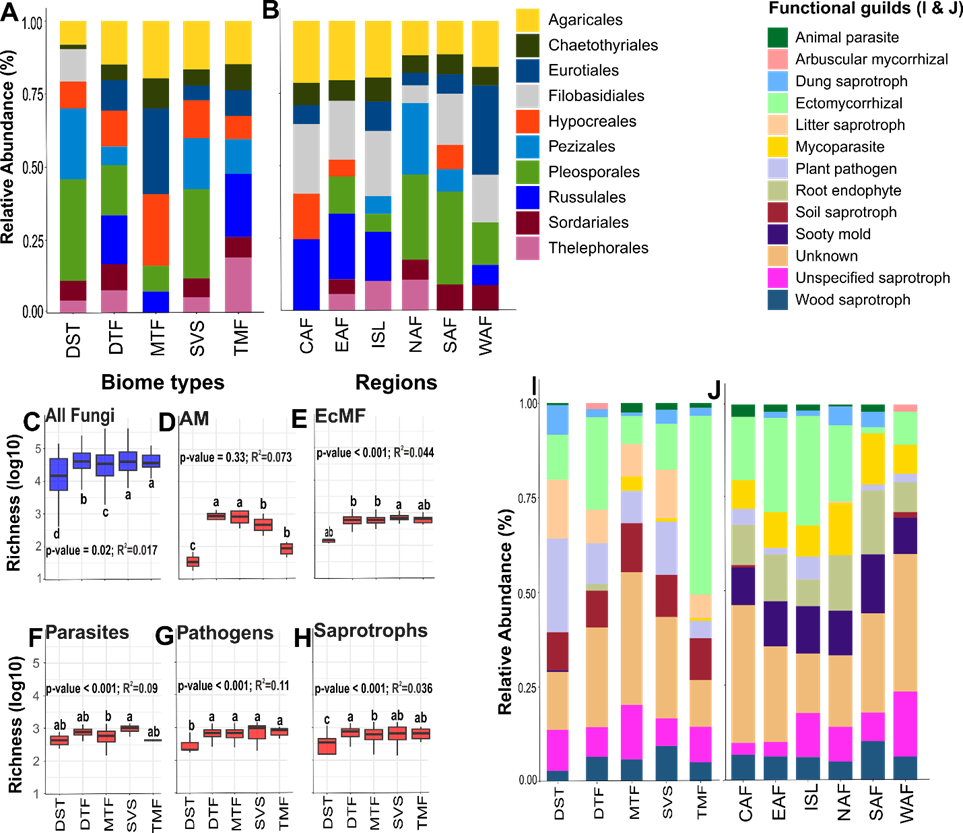 Fig 4. Taxonomic distribution of fungi and functional guilds across African biome types and regions. (A) Relative abundance of the top ten orders across biome types and (B) regions. Richness of (C) All fungi, (D) AMF, (E) EcMF, (F) Parasites, (G) Pathogens, and (H) Saprotrophs across biome types. (I) Relative abundance of the top thirteen functional guilds across biome types and (J) regions. Key: DST = Deserts, DTF = Dry tropical forests, MTF = Moist tropical forests, SVS = Savannas, TMF = Temperate mixed forests, CAF = Central Africa, EAF = East Africa, NAF = Northern Africa, ISL = Islands, SAF = Southern Africa, WAF = West Africa. Different letters indicate statistically significant differences according to Tukey’s HSD test.
Fungal richness differed significantly across the five principal biome types of Africa identified in this study (F = 2.66, df = 4; p = 0.022). Savannas, temperate mixed forests, dry tropical forests, and moist tropical forests exhibited the highest fungal richness, respectively, while desert biome types showed the lowest richness in our dataset (Figs. 4C, 5A). At the biome level, we observed a significant variation in species composition, particularly in moist and dry tropical forests (Fig. 5B). At the regional level, Central and East Africa exhibited the highest fungal richness, while Northern Africa exhibited the lowest (Fig. 5C).
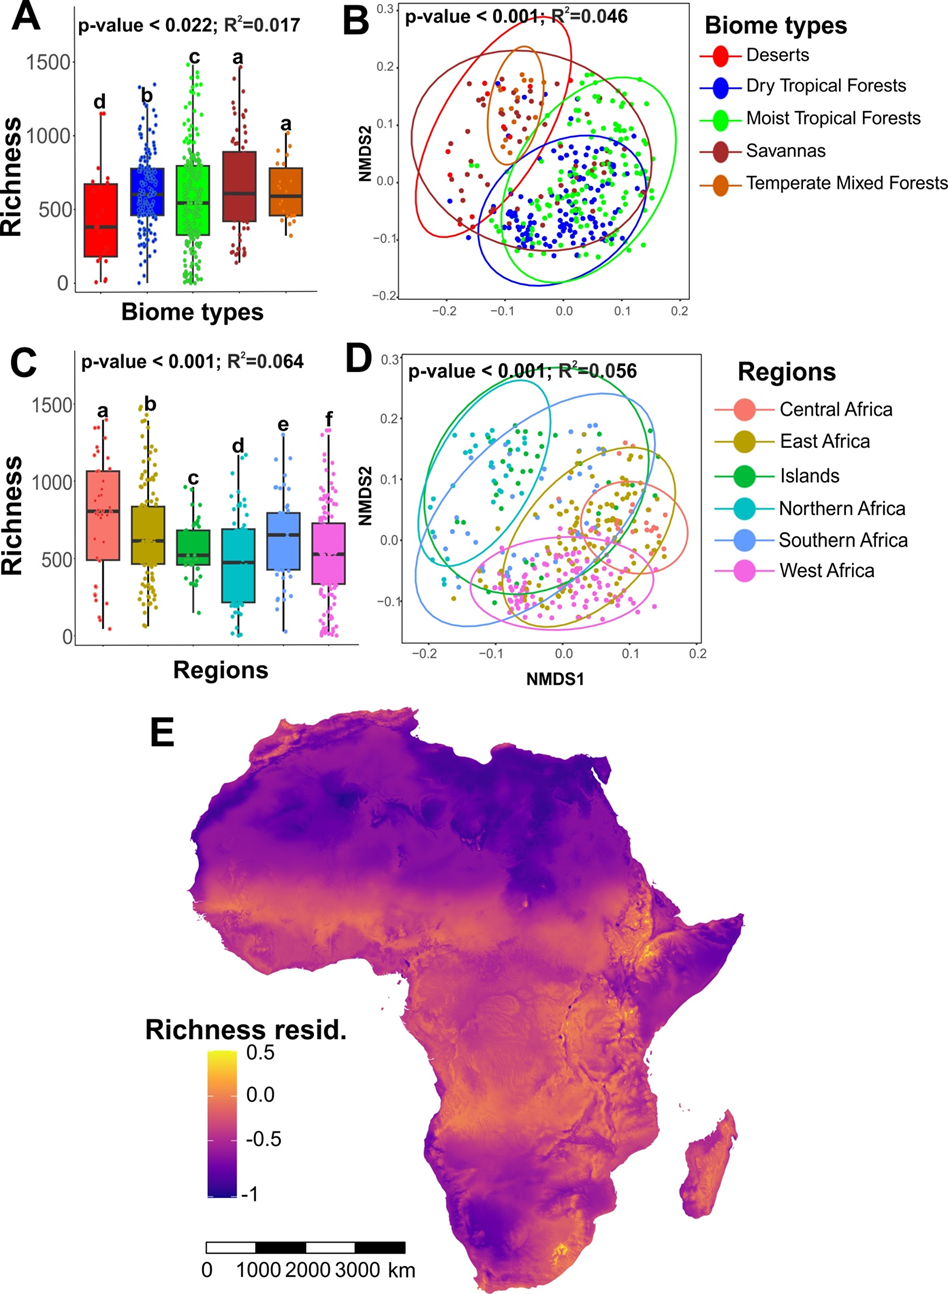 Fig 5. Pattern of fungal richness and community composition across African ecosystems. (A) Fungal richness across biome types. (B) NMDS ordination of the fungal community structure across biome types in this study. (C) Fungal richness across African regions. (D) NMDS ordination of the fungal community structure across African regions. (E) African map predicting total fungal richness using GAM. Warm colors indicate OTU-rich sites whereas cold colors indicate areas that are low in OTUs.
OTU richness of fungal guilds varied significantly across ecosystems, with saprotrophic fungi dominating most habitats. There were significant differences in saprotroph diversity across habitats (F = 8.89; df = 4; p < 0.001), with the highest diversity in dry and moist tropical forests, while desert biomes exhibited the lowest saprotroph diversity. EcMF showed relatively higher richness in savannas, dry and moist tropical forests (F = 4.56; df = 4; p = 0.001; Fig. 4E), where host trees are relatively abundant. EcMF were relatively less widespread at the continental scale, with the highest abundance in temperate mixed forests and dry tropical forests in the Islands, East, Northern, and Central Africa (Fig. 4I). AMF showed greater abundance in dry tropical forests across biome types (Fig. 4I), but there were no significant differences between AMF richness across biome types (p > 0.05) (Fig. 4D). AMF were more abundant in West Africa, probably emphasizing that tropical climate and seasonal rainfall patterns form ideal conditions for AMF growth, particularly in forest-savanna ecotones (Fig. 4J). We also observed significant differences between biome types in parasites (F = 3.66, df = 4; p = 0.008) and pathogens (F = 10.03, df = 4; p < 0.001), both of which displayed the greatest richness in savanna biomes (Fig. 4G & H).
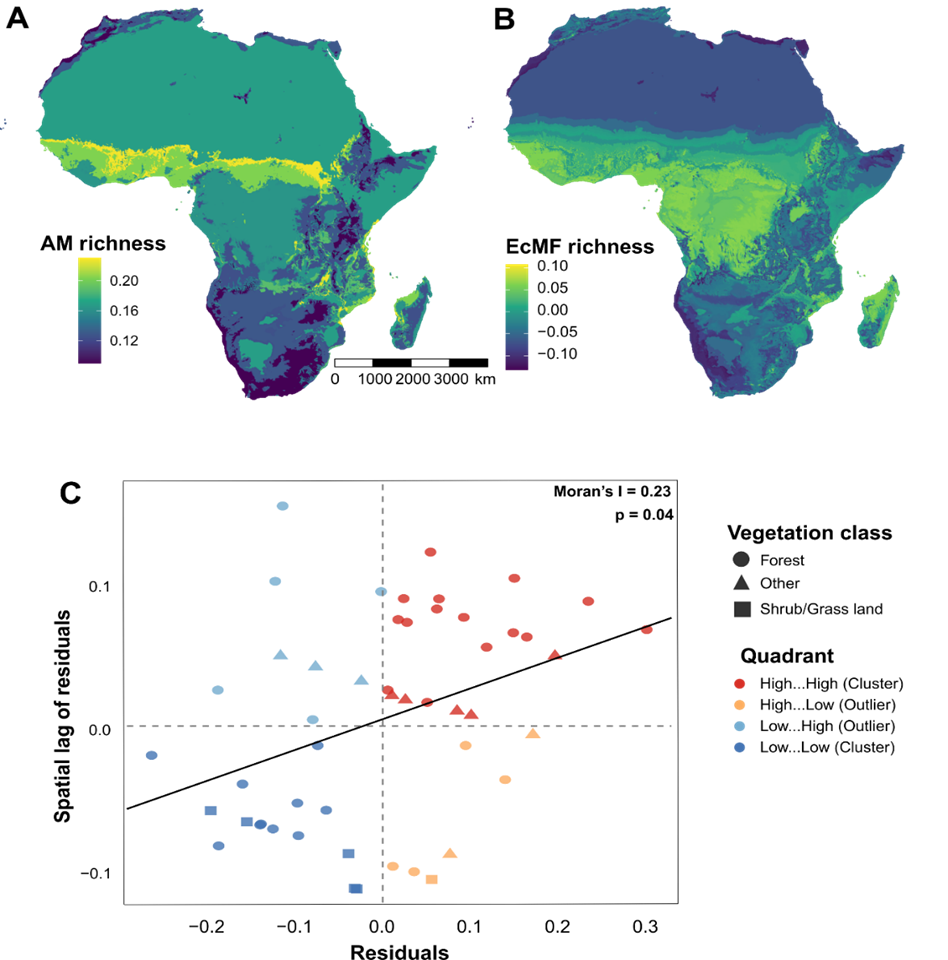 Fig 6. African mycorrhizal fungal hotspots. (A) AMF richness across Africa. (B) EcMF richness across Africa. (C) Effect of vegetation cover type on mycorrhizal fungal richness across Africa.
We created a high-resolution prediction map of fungal richness in Africa by combining BIO10 and BIO12 raster data from the CHELSA database with our fungal data. Our map illustrates the distribution of fungal richness across Africa, highlighting environmental dependencies and identifying cold spots in deserts and hot spots in the West-East African belt, as well as in Central and Southern Africa (Fig. 5E).
Our random forest models successfully predicted spatial patterns of fungal richness for the two mycorrhizal types (AMF and EcMF). The models explained a significant portion of the variance in observed richness, demonstrating greater predictive accuracy for AMF (R² = 0.857, RMSE = 0.907) compared to EcMF (R² = 0.569, RMSE = 0.743). The spatial prediction maps revealed distribution patterns between AMF and EcMF in Africa, with EcMF showing higher richness in forested and tree-dominated areas, whereas AMF richness was distributed in open habitats and savannas (Fig. 6). Areas with dense tree cover and high moisture climates —more particularly along the Guineo-Congolian forest belt in West Africa — show the greatest AMF richness (Fig. 6A). On the other hand, more richness of EcMF was observed around the Congo Basin and Central Africa, where there is a high density of forest trees (Fig. 6B).
When the vegetation class from our land cover data was included as a predictor in our spatial autocorrelation assessment (Moran’s I statistic), it revealed distinct geogr-aphical patterns in vegetation class (presence and diversity of trees) and general fungal richness. Moran’s I test revealed a significant and positive spatial autocorrelation in the model residuals (I = 0.23, p = 0.04). Moran’s scatter plot also showed clusters of high-high (red) and low-low (dark blue) areas based on the type of vegetation cover, representing areas where observed and predicted richness values were either both high or both low. Meanwhile, high-low and low-high outliers (orange and light blue, respectively) indicated local deviations from regional trends (Fig. 6C).
MAP, K, elevation, C, N, P, Ca, and Mg positively influ-enced fungal richness (Fig. S1); in other words, increases in these variables led to a rise in fungal diversity. Carbon and nitrogen were the main factors driving soil fungal richness in our dataset in terms of soil chemical properties, accounting for 23% and 24% of the variation, respectively, in our model (Fig. S1). Conversely, latitude, soil pH, MAT, and C: N ratio (Fig. S1) negatively affected fungal richness, indicating that fungal diversity tends to increase as these variables decrease.
-
Fungal community structure
Our PERMANOVA analysis revealed that the climatic variables MAT and MAP, and soil pH were the strongest drivers of fungal community structure (MAT: R2 = 0.022, F = 9.38, p < 0.001; MAP: R2 = 0.018, F = 7.96, p< 0.001; and soil pH: R2 = 0.02, F = 8.71, p< 0.001) (Table S1). Distance-based RDA also showed the importance of MAT, MAP, and soil pH in driving fungal community structure (Fig. S2). Our variable importance analysis, based on the random forest algorithm, revealed the impact of climate and other variables on the soil fungal community, with total nitrogen emerging as the most important variable (Fig. S2). This could further explain the well-established paradigm that nitrogen is a key limiting factor in many terrestrial ecosystems. Several of the soil chemical properties, as well as climatic and spatial variables, were found to be correlated and therefore could be regarded as co-dependent (Fig. S2). It is essential to note that we retained correlated variables because each one reflects a distinct ecological process relevant to our study. Omitting these variables could either obscure or limit our understanding of biologically significant relationships and interactions that are essential for understanding fungal community dynamics.
Fungal communities in Africa were largely shaped by the varied climates and different biome types on the continent. Clustering of samples based on regions (p < 0.001, R2 = 0.056) and biome types (p < 0.001, R2 = 0.046) significantly explained the variation in fungal community structure. Our NMDS plot also showed a higher diversity pattern in moist and dry tropical biomes compared to other biome types, with a significant variation in species composition. Although Northern Africa had the lowest fungal richness, all regions exhibited significant variation in species composition (Fig. 5C & D).
-
Distribution and determinants of fungal richness
We used metabarcoding of the ITS marker to assess soil mycobiome diversity across 32 African countries. To our knowledge, this is the most extensive study on African soil fungi, covering all African biome types and more than half of the countries on the continent. Although our findings revealed a notably greater fungal richness in savanna biomes compared to moist tropical forests, this was contrary to the second part of our initial hypothesis. The statistical similarity between this biome type and mixed temperate forests suggests that other factors within the broad biome classification also influence fungal richness. The high richness in the savanna biome type could be driven by other mechanisms, such as fire frequency effect and habitat heterogeneity, as well as edaphic and climatic factors (Maquia et al. 2020; Poswa et al. 2024). Similarly, a recent global study predicted major hotspots of AMF richness and endemicity across the savannas of the Brazilian Cerrado, tropical forests in Southeast Asia, and Guinean forests in West Africa (Van Nuland et al. 2025). At the regional scale, soil fungal richness and diversity peaked in Central and East Africa. Conversely, extreme arid and semi-arid areas such as the Sahara and Namib deserts impose physiological constraints on fungal survival, resulting in lower diversity and distinct community composition dominated by xerotolerant taxa (Makhalanyane et al. 2015; Johnson et al. 2017; Egidi et al. 2019).
African soil fungal biodiversity exhibits peaks in savannas, temperate mixed forests, dry tropical rainforests and moist tropical rainforests of the Congo Basin and East Africa. Similarly, a relatively higher fungal biodiversity has been recorded in the world's tropical regions, more specifically in the Afrotropical forests (Tedersoo et al. 2014; Corrales et al. 2022; Mikryukov et al. 2023). These fungal biodiversity hot spots are characterized by high precipitation, stable temperatures, and dense vegetation, providing conducive environmental conditions for fungal growth and sporulation, organic matter decomposition, and symbiotic interactions with plants and animals. The Congo Basin and Guinean forests are recognized as biodiversity hotspots and are home to a wide variety of animals (Resende & Meikengang 2023), plants (White 1983), and fungi (Tondeleir et al. 2025). This region is particularly notable for its rich diversity of ectomycorrhizal fungi (EcMF) and saprotrophic fungi (Kamalebo et al. 2018), which play essential roles in nutrient cycling and overall ecosystem function.
Aspergillaceae, a family that includes several species capable of causing respiratory diseases in humans and animals, especially within the genus Aspergillus, dominates our dataset (Fig. 2), corroborating the findings of Janowski & Leski (2023). The high abundance of the fungal families Russulaceae and Thelephoraceae, as revealed by our data in the Krona chart (Fig. 3), was also observed in a recent global study (Tedersoo et al. 2021), which indicates the high abundance of these families at both global and continental scales. Our data showed that Russulales was more common in East and Central Africa than in any other regions in this study. This may be due to their dominance among EcMF (genera Russula and Lactifluus), which engage in mutualistic relationships with many tree species in these areas. Tondeleir et al. (2025) found the family Russulaceae to be abundant in tropical Africa, thriving in the humid Guinean-Congolian forests (Central Africa) and in the Miombo woodlands of East Africa, which supports our findings. A recent study (Meidl et al. 2021) indicates that Pleosporales is the dominant order in xeric and desert microsites in central Namibia, aligning with the high abundance of the same order observed in our desert biomes in our dataset. In a recent study by Tidimalo et al. (2024), indicated that Pleosporales dominate arid and semi-arid soils of Botswana, a finding also observed in our data for Southern and Northern Africa at the regional level.
Our findings revealed that soil chemical properties, as well as climatic and geographic variables, influence the diversity and community distribution of African soil fungi. MAT, MAP, and soil pH were the best predictors of fungal community composition. We observed a positive effect of MAP on fungal richness, consistent with the patterns observed in global studies, which highlights moisture availability as a key determinant of fungal community structure. Shifts in rainfall patterns or extended dry periods can influence water availability, a key factor driving fungal growth and activity in tropical and subtropical regions (Zhao et al. 2017; Bahram et al. 2018). This suggests that shifts in rainfall patterns and increasing regional temperatures could have a profound impact on soil fungi. Our results also revealed that soil fungal richness is prominent in weakly acidic soils in Africa (Fig. S1G), which agrees with general global trends (Tedersoo et al. 2014; Mikryukov et al. 2023). Additionally, the cascading effects of climate change on soil chemical characteristics, including changes in pH (Jiao et al. 2016) and vegetation cover (Arneth 2015), are likely to amplify the impact of climate change on fungal communities. Another study similarly found that soil chemical properties influence fungal richness, which in turn improves soil health in agricultural soils (Häkkinen et al. 2025). This underscores the importance of these variables in sustaining a healthy ecosystem, particularly one with such vast diversity and underexplored areas as the African continent.
In general, soil saprotrophs appeared to be the most diverse group in our dataset, prevailing in all biome types defined in this study, especially in dry tropical forests, moist tropical forests, and savannas. EcMF were relatively more abundant in the temperate mixed forests of Morocco and Pantelleria. Moist and dry tropical forests exhibited the greatest diversity among most fungal guilds, including EcMF, AMF, plant pathogens, and saprotrophs in our study. Our results indicate that animal parasites and mycoparasites together tend to be the most OTU-rich in the savanna biome. Importantly, our study suggests that pathogenic and parasitic fungi are relatively more abundant in desert biomes than in other biome types. This could be due to the paucity of organic material and mycorrhizal host plants in deserts.
-
Community composition of fungi
African soil fungal communities are mainly shaped by climatic variables such as MAP and MAT or soil variables such as pH, N availability, P availability, and C: N ratio, in agreement with studies on other geographic scales (Tedersoo et al. 2014, 2022; Sarkodee-Addo et al. 2020). The soils of most African biomes are dominated by saprotrophic fungi. Tropical forests, especially those in the Congo basin, harbor high fungal diversity, dominated by EcMF and saprotrophic fungi, which play critical roles in decomposition and plant symbiosis. AMF are more widespread and especially abundant in semi-dry woodlands and savannas. These fungi enhance plant adaptation to water-stressed environments by improving nutrient uptake and increasing stress resilience (Zhang et al. 2019; Yan et al. 2022). Our NMDS plots also reveal distinct clusters, with savannas, dry tropical forests, and moist tropical forests each hosting unique fungal taxa at the biome level. A strong biome-driven clustering, with rainforests, gallery forests, and woodlands forming distinct communities, was revealed by Tondeleir et al. (2025). The strong clustering of points in West, East, and Central Africa in our NMDS plot at the regional level also aligns with previous studies, which attributed these distinct patterns to shared climatic and vegetation features, evolutionary history, and the dominance of EcMF (Alem et al. 2022; Tondeleir et al. 2025).
We emphasize that a significant portion of the fungal community structure could not be explained by the environmental factors examined in our study. This suggests that other deterministic factors not accounted for in this study, such as landscape-scale niche differentiation or stochastic variables related to dispersal, could play important roles in shaping the fungal community composition of African soils.
-
Continental-scale biogeography of mycorrhizal fungi
The biogeography of fungi in Africa is shaped by a complex interaction of climate, soil characteristics, vegetation types, and plate tectonics. African biomes, which range from arid deserts to lush tropical rainforests, host various types of mycorrhizae, especially AMF and EcMF. The distribution of these mycorrhizal types is usually influenced by climatic gradients, soil chemical properties, and vegetation types (Soudzilovskaia et al. 2019), all of which affect the functioning of plant communities across the continent (Rodríguez-Echeverría et al. 2017). Here, we observed that biome types have a significant influence on the distribution of mycorrhizal types. This is primarily attributable to the effects of climate and the availability of host plants.
Arbuscular mycorrhizae are the most widespread type of mycorrhizae in Africa, AMF being primarily associated with grasses, shrubs, and various crop species (Mukhongo et al. 2016). AMF thrive in arid and semi-arid regions due to their drought tolerance and the lack of ectomycorrhizal tree vegetation in these areas. However, we observed a relatively high abundance of AMF in Guinean forests of West Africa and dry tropical forests that had low or no ectomycorrhizal tree vegetation. A previous study also showed that West African savannas harbor a rich diversity of AMF (Tchan et al. 2022), which reflects the high diversity in savanna biomes in our study. The genus Rhizoglomus is the most prevalent AMF taxon in our dataset, particularly in Benin and Tanzania, which corroborates the findings of Sarkodee-Addo et al. (2020) and Tchabi et al. (2008).
Our results also revealed that tree presence and vegetation type significantly influence mycorrhizal fungal richness in African ecosystems (Fig. 6A & B). Our inclusion of land cover as a proxy for tree presence and potential mycorrhizal host species significantly improved the accuracy of our model, supporting the hypothesis that fungal richness is associated with tree presence and/or the availability of potential mycorrhizal hosts. Our results revealed that MAT and MAP were the major predictors of both AMF and EcMF random forest models, with AMF showing higher richness hotspots than EcMF. This corroborates recent studies (Rodríguez-Echeverría et al. 2017; Van Nuland et al. 2025). Significant spatial autocorrelation (as indicated by a positive Moran’s I statistic) further suggests that vegetation clustering plays a crucial role in determining fungal richness and community patterns (Tedersoo et al. 2011; Meidl et al. 2021).
In contrast, we found EcMF to be more abundant in humid and nutrient-poor forest ecosystems, corroborating previ¬ously known Africa-wide patterns of mycorrhizal type distri¬bution in plants (Soudzilovskaia et al. 2019). The relative abundance of EcMF peaks in temperate mixed forests found in Morocco and Pantelleria. Central and East Africa also have a relatively higher abundance of EcMF, particularly associ¬ated with hosts from the plant families Fabaceae, Phyllan¬thaceae, and Dipterocarpaceae, compared to other regions. Conversely, EcMFs are absent from desert areas, forests in the Drakensberg mountains, and the Ethiopian highlands, and are rare in Réunion. Our continent-wide prediction map of all fungi and mycorrhizal fungi can serve as a reference for environmental monitoring and policy development at national and continental levels, as it is the first to combine full ITS sequences from 467 soil samples with ESA-CCI land cover data, highlighting the importance of vegetation type and cover on fungal richness.
-
This study investigated the diversity and ecological functions of soil fungi across various African biomes, addressing a significant gap in fungal biodiversity and ecology. The African continent, spanning diverse biomes from tropical forests to arid deserts, hosts rich and diverse fungal guilds, including mycorrhizal, saprotrophic, pathogenic, and parasitic fungi. The results of this study align with the general global pattern of soil fungal diversity reported in several studies. We observed that fungal richness was the highest in the central and eastern regions of Africa, surrounding the Congo Basin. In contrast, the arid areas, like the Sahara and Kalahari, harbour relatively low fungal diversity, reflecting the constraints imposed by the climate. Temperature, precipita¬tion, and the resulting biome types play a significant role in explaining biodiversity and composition of African soil fungi. These findings highlight the crucial role of fungal communi¬ties in maintaining soil health and facilitating carbon cycling, particularly within biodiversity hotspots that are under threat from desertification, deforestation, and climate change. Although significant sampling gaps remain in difficult-to-ac¬cess countries, our results reveal continental maps of soil fungal distribution and highlight the responses of fungi to environmental changes, thereby informing conservation strategies. Ultimately, protecting these hotspots is essential for the sustainability of agriculture, forestry, human health, and the overall resilience of these ecosystems.
-
We thank all contributors of soil samples for the GSMc initiative and institutions of multiple countries for providing sampling and export permits. This work was funded by the Estonian Science Foundation (grant PRG632) and the Centre of Excellence AgroCropFuture.
-
The authors declare no conflicts of interest in relation to this study.
-
Raw sequencing data from this study are deposited in the European Nucleotide Archive (ENA) at EMBL-EBI under acc-ession number PRJEB106538 ( https://www.ebi.ac.uk/ena/browser/view/PRJEB106538).
-
The online version contains supplemental information available at https://doi.org/10.65390/fdiv.2026.136005, Supplementary File to this study.
Fig 1.
Sample distribution map and taxon abundance. (A) Geographic distribution of 467 sampling plots within five African biome types. (B) Mean relative abundance of dominant (>1%) phyla obtained from our samples. (C) Number of samples obtained from each region in this study.
